2026 Market Outlook:

Why 2026 is the Best Year to Enter Market, Upgrade, or Invest in DECADES!

Ateam Vancouver | Buying | Real Estate

There are currently 12,550 homes listed for sale—nearly 35% above the 10-year seasonal average—offering a wealth of selection we haven’t seen in years.

Happy New Year! As we step into 2026, the Metro Vancouver real estate market is presenting a unique landscape. 2025 was a year for the history books, seeing the lowest annual sales total in over two decades. Total sales finished the year down 10.4% from 2024, a shift that has created a significant increase in available inventory. There are currently 12,550 homes listed for sale—nearly 35% above the 10-year seasonal average—offering a wealth of selection we haven’t seen in years.

Metro Vancouver Residential Sales to Active Ratio

Sales-to-Active Listings Ratio: 

The combination of lower prices and decreased borrowing costs (which fell nearly a full percentage point last year) is creating the most favourable entry conditions in recent history. Benchmark prices have fell by 4.5% over the past year to $1,114,800. Downward pressure is particularly visible for detached homes, where the sales-to-active listings ratio has dipped to 9.3%, firmly into "buyer’s market" territory. This means more room for negotiation and more selection.

Lets have a look at the charts below that show the trends in sales, active listings, and benchmark price.

Ateam Vancouver | Buying and Selling | Real Estate

Metro Vancouver Detached Sales to Active Ratio

Ateam Vancouver | Buying and Selling | Real Estate

Metro Vancouver Townhomes Sales to Active Ratio

Ateam Vancouver | Buying and Selling | Real Estate

Metro Vancouver Condos Sales to Active Ratio

Ateam Vancouver | Buying and Selling | Real Estate

These dynamics make it an excellent time to 1) enter the market, 2) upgrade, or 3) invest in a second property. Because prices eased across all property types, the "price gap" to move from a condo or townhouse into a detached home has shrunk dramatically, making upgrades possible that were financially out of reach just two years ago.

Let's look at a few examples of this using the East Vancouver data:

Townhouse to Detached House:

Property Type

Dec 2024 Benchmark

Dec 2025 Benchmark

Year-Over-Year Change

Detached Home

$1,859,300

$1,718,800

- 7.6%

Townhouse

$1,134,000

$1,035,100

- 8.7%

The Upgrade Gap

$725,300

$683,700

Down $41,600

Condo to Detached House:

Property Type

Dec 2024 Benchmark

Dec 2025 Benchmark

Year-Over-Year Change

Detached House

$1,859,300

$1,718,800

- 7.6%

Condo

$690,600

$650,100

- 5.9%

The Upgrade Gap

$1,168,700

$1,068,700

Down $100,000

Condo to Townhome:

Property Type

Dec 2024 Benchmark

Dec 2025 Benchmark

Year-Over-Year Change

Townhouse

$1,134,000


$1,035,100


- 8.7%

Condo

$690,600


$650,100


- 5.9%

The Upgrade Gap

$443,400

$385,000

Down $58,400

This means the difference of several hundred dollars per month in mortgage payments for your upgraded property cost vs what it was a year ago. Not even taking into account the drop in interest rates!

With consumer sentiment improving as we head into 2026, now is the time to make the upgrade you have been considering!

Mortgage Outlook

Closing out 2025, it is now anticipated that the Bank of Canada will have completed its interest rate easing cycle. Interest rates are expected to hold steady throughout 2026, providing a more stable environment for the housing market compared to the volatility experienced in previous years caused by drastic rate swings.

Metro Vancouver Real Estate Market - Heats Up This August!

Easing Home Prices, More Homebuyers, Increased Transactions!

Ateam Vancouver | Buying | Real Estate

Residential Sales: A total of 1,959 homes were sold in August 2025, which is a 2.9% increase from the 1,904 sales in August 2024.

This summer has brought a noticeable shift in the Metro Vancouver real estate market, with sales activity showing a steady recovery. Easing home prices have successfully drawn more homebuyers into the market, leading to an increase in transactions compared to last year. This renewed activity, particularly in the detached and attached home segments, suggests that buyers are feeling more confident and are ready to make their move.

Let's look at the key numbers for Metro Vancouver from this past month. The market is showing clear signs of rebalancing, with both sales and inventory levels responding to the current climate.

  • Residential Sales: A total of 1,959 homes were sold in August 2025, which is a 2.9% increase from the 1,904 sales in August 2024.

  • Increased Inventory: The total number of homes listed for sale is 16,242, a significant 17.6% increase compared to August of last year. This is also 36.9% above the 10-year seasonal average.

  • New Listings: There were 4,225 new listings in August 2025, which is a 2.8% increase from the same month in 2024 and 1.3% above the 10-year average.

On the pricing front, we've seen a slight moderation, which has been instrumental in boosting sales. The composite benchmark price for all residential properties in Metro Vancouver now sits at $1,150,400. This is a 1.3% decrease from July 2025 and a 3.8% decrease from August 2024. Here is the benchmark price breakdown by property type:

  • Detached Homes: $1,950,300, down 1.2% from the previous month.

  • Attached Homes (Townhouses): $1,079,600, a 1.8% decrease from July 2025

  • Apartment Homes: $734,400, representing a 1.3% dip month-over-month.

As the summer haze gives way to crisp autumn air, the market is also experiencing its traditional seasonal resurgence. We're seeing this trend unfold right now, with a notable increase in traffic on our listings and a significant uptick in activity across major home search platforms. This growing buyer engagement signals that a fresh wave of motivated individuals is entering the market, and coming off the sidelines

Metro Vancouver Residential Sales to Active Ratio

Sales-to-Active Listings Ratio: The overall ratio is 12.4% (a balanced market). For detached homes, the ratio is 9.3% (a buyer’s market), while attached homes and apartments are at 15.8% and 14% respectively (both balanced markets).

Ateam Vancouver | Buying and Selling | Real Estate

Vancouver West Sales to Active Ratio

Ateam Vancouver | Buying and Selling | Real Estate

Vancouver East Sales to Active Ratio

Ateam Vancouver | Buying and Selling | Real Estate

What this means for you?

For Buyers: The current market presents a fantastic window of opportunity. The combination of increased inventory and slightly lower prices means more choice and greater negotiating power. It’s a chance to enter the market under less pressure than we've seen in recent years.

For Sellers: The outlook is also positive. The uptick in sales activity demonstrates a growing demand. As more buyers come off the sidelines, the increased inventory may begin to diminish, which could signal the closing of this buyer's window.

Overall, the August statistics confirm a slow but steady recovery in our local market. The alignment of buyer and seller expectations is helping to drive transactions forward. As we move into the fall, these trends of increasing sales and active listings are worth watching closely. If you've been considering a move, now is an excellent time to discuss your options.

📬

April 2025 Market Update!

Inventory Up, Sales Down, Price Stable Amidst Economic Uncertainty

Ateam Vancouver | Buying | Real Estate

The MLS Home Price Index composite benchmark price for all residential properties in Metro Vancouver is currently $1,184,500

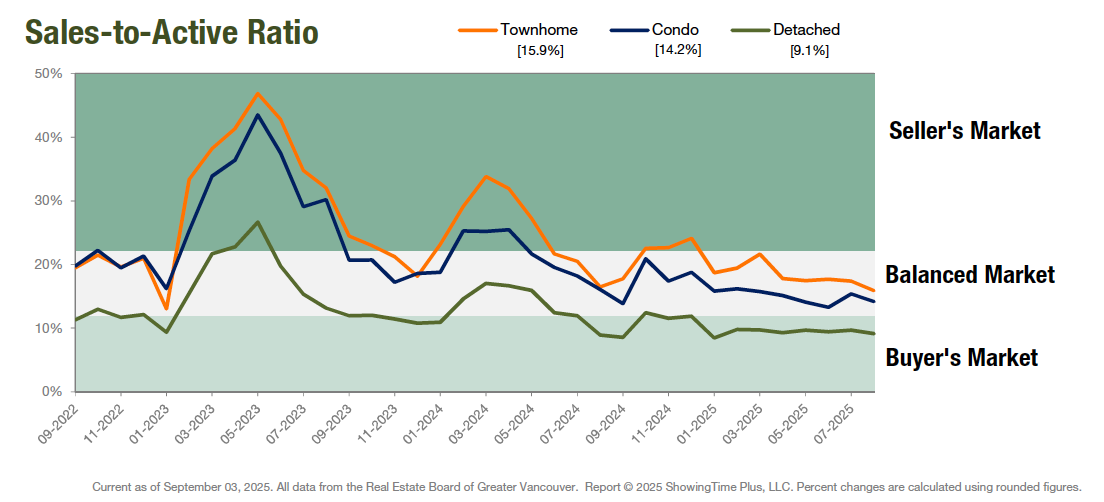
April's real estate market followed the established trend of 2025, marked by elevated inventory levels and corresponding decrease in sales activity. While home prices have remained relatively stable, this stability is partly attributed to some sellers opting to wait out the current market conditions.

Despite significant pent-up demand, economic uncertainty continues to act as ahead wind, preventing this demand from fully materializing. However, the conclusion of Canada's federal election has ended a period of market hesitancy, and we anticipate this will encourage both new buyers and sellers to enter the market.

The MLS Home Price Index composite benchmark price for all residential properties in Metro Vancouver is currently $1,184,500. This represents a 1.8% decrease over April 2024 and a 0.5% decrease compared to March 2025.

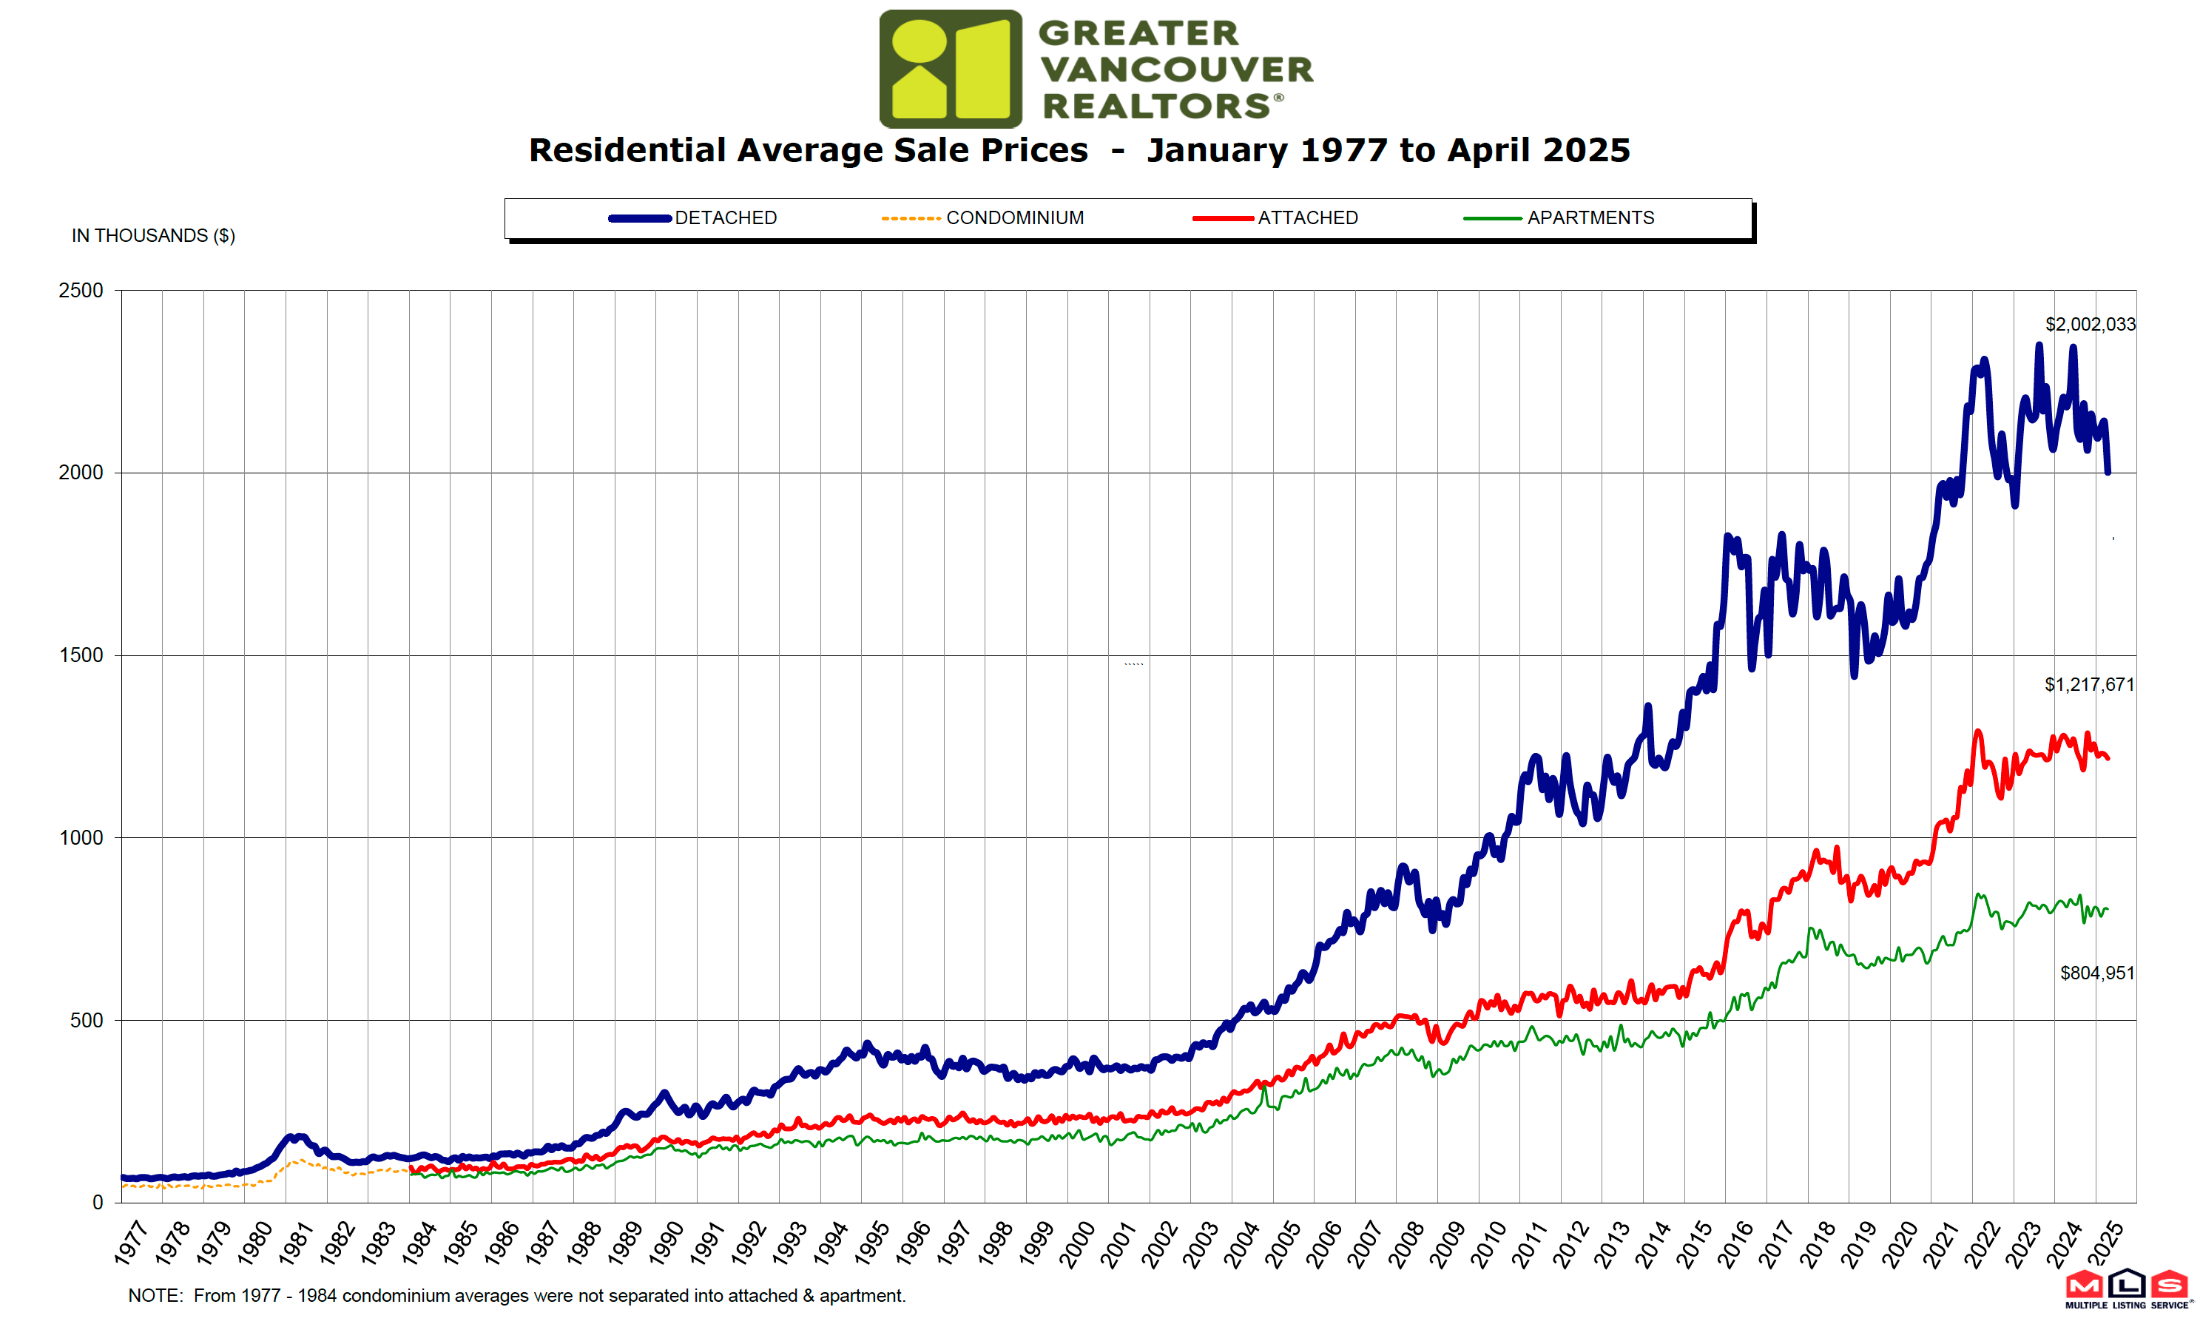
Sales of detached homes in April 2025 reached 578, a 29% decrease from the 814 detached sales recorded in April 2024. The benchmark price for a detached homes $2,021,800. This represents a 0.7% decrease from April 2024 and a 0.6% decrease compared to March 2025. 

Sales of apartment homes reached 1,130 in April 2025, a 20.2% decrease compared to the 1,416 sales in April 2024. The benchmark price of an apartment home is $762,800. This represents a 2% decrease from April 2024 and a 0.6% decrease compared to March 2025. 

Attached home sales in April 2025 totalled 442, a 23.8% decrease compared to the 580 sales in April 2024. The benchmark price of a townhouse is $1,102,300. This represents a 2.9% decrease from April 2024 and a 1% decrease compared to March 2025.

Greater Vancouver Average Sales Price

Residential Average Sale Prices | January 1977 - April 2025

Looking at the broader provincial picture, slower sales are pushing resale inventory to an average above 40,000 listings – a level not seen in over a decade. Consequently, we expect some regions and market segments to experience downward pressure on average prices. Nevertheless, our overall forecast remains largely or flat average prices, as many sellers appear willing to hold firm in the current environment.

Ateam Vancouver | Buying and Selling | Real Estate
48+ YEARS

Mortgage Market Update

April 2025

Interest rates, controlled by the Bank of Canada, have fallen a lot since the peak at 7.20% in July 2023 with the Bank of Canada reducing the overnight rate by 2.25% leaving us with a current prime lending rate of 4.95%.

Bond Markets control most of the fixed rates. As of late there has been extreme volatility in the Bond Markets caused by uncertainty created through political measures. The Trump Tariff war has had a huge impact on the bond markets in the US and Canada; our own election and an expected large increase in Canada issuing bonds to pay for the election promises; and overall global economic changes have the bond market going up and down throughout the day. Our mortgage rates hit a bottom around April 4th and since then yields have increased a fair bit.

 The current consensus is that the US has a 90% chance of a recession and Canada is likely to follow. If this is the case we could see bond markets price in lower inflation and fixed rates could drop. The Bank of Canada is expected to reduce the overnight rate by .75% this year.

Ateam Vancouver | Buying and Selling | Real Estate
Reciprocity Logo The data relating to real estate on this website comes in part from the MLS® Reciprocity program of either the Greater Vancouver REALTORS® (GVR), the Fraser Valley Real Estate Board (FVREB) or the Chilliwack and District Real Estate Board (CADREB). Real estate listings held by participating real estate firms are marked with the MLS® logo and detailed information about the listing includes the name of the listing agent. This representation is based in whole or part on data generated by either the GVR, the FVREB or the CADREB which assumes no responsibility for its accuracy. The materials contained on this page may not be reproduced without the express written consent of either the GVR, the FVREB or the CADREB.